Show the code
pacman::p_load(refugees,tidyverse,unhcrthemes,ggplot2,ggrepel,directlabels,scales,forcats)The United Nations High Commissioners for Refugees, has created an R package to help accessing the Refugee Data Finder. The API contains a range of datasets, flowing in from three main sources. The first is from the annual statistical activities dating back to 1951. The second is from the United Nations Relief and Works Agency for Palestine Refugees in the Near East, otherwise known as UNWRA. In specific, Palestinian refugees registered under UNWRA’s mandate. The third source is from the Internal Displacement Monitoring Centre, otherwise known as IDMC, which contains information on internally displaced populations. Let’s load the relevant packages:
pacman::p_load(refugees,tidyverse,unhcrthemes,ggplot2,ggrepel,directlabels,scales,forcats)For this blog post we will create three visualisations answering slightly different questions and exploring different aspects of the dataset.
The first visual focuses on the UNWRA dataset included as part of the package, exploring the change in the total number of Palestinian refugees from 1952 to 2002:
refugees::unrwa %>%
  filter(year == 1952 | year == 2022) %>%
  select(year,coa_name,total) -> slope

slope %>%
  ggplot(aes(
    year,
    total,
    group= coa_name
  ))+
  geom_line(
    linewidth = 0.75,
    color = "midnightblue" #unhcr_pal(n=1, "pal_blue")
  )+
  geom_text_repel(
    data = slope |> filter(year == 1952),
    aes(label = paste(
      coa_name,
      if_else(total > 1e6,
              paste0(round(total / 1e6, 1), "M"),
              paste0(round(total / 1e3, 1), "k")
      )
    )),
    size = 8 / .pt,
    hjust = 1,
    direction = "y",
    nudge_x = -0.3,
  ) +
  geom_text_repel(
    data = slope |> filter(year == 2022),
    aes(label = paste(
      coa_name,
      if_else(total > 1e6,
              paste0(round(total / 1e6, 1), "M"),
              paste0(round(total / 1e3, 1), "k")
      )
    )),
    size = 8 / .pt,
    hjust = 0,
    direction = "y",
    nudge_x = 0.3,

  )+
  geom_point(
    size = 2.5,
    color = "midnightblue" #unhcr_pal(n = 1, "pal_blue")
  )+

  scale_x_continuous(
    breaks = c(1952, 2022),
    limits = c(1950, 2024)
  ) +
  scale_y_continuous(limits = c(-2e5, NA)) +
  theme_unhcr(
    grid = "X",
    axis = FALSE,
    axis_title = FALSE,
    axis_text = "X"
  )+
  labs(
    title= "Change in Number of Palestinian Refugees\nRegistered Under UNRWA's Mandate | 1952 vs. 2022",
    caption = "Source: UNHCR Refugee Data Finder\n© UNHCR, The UN Refugee Agency"
  )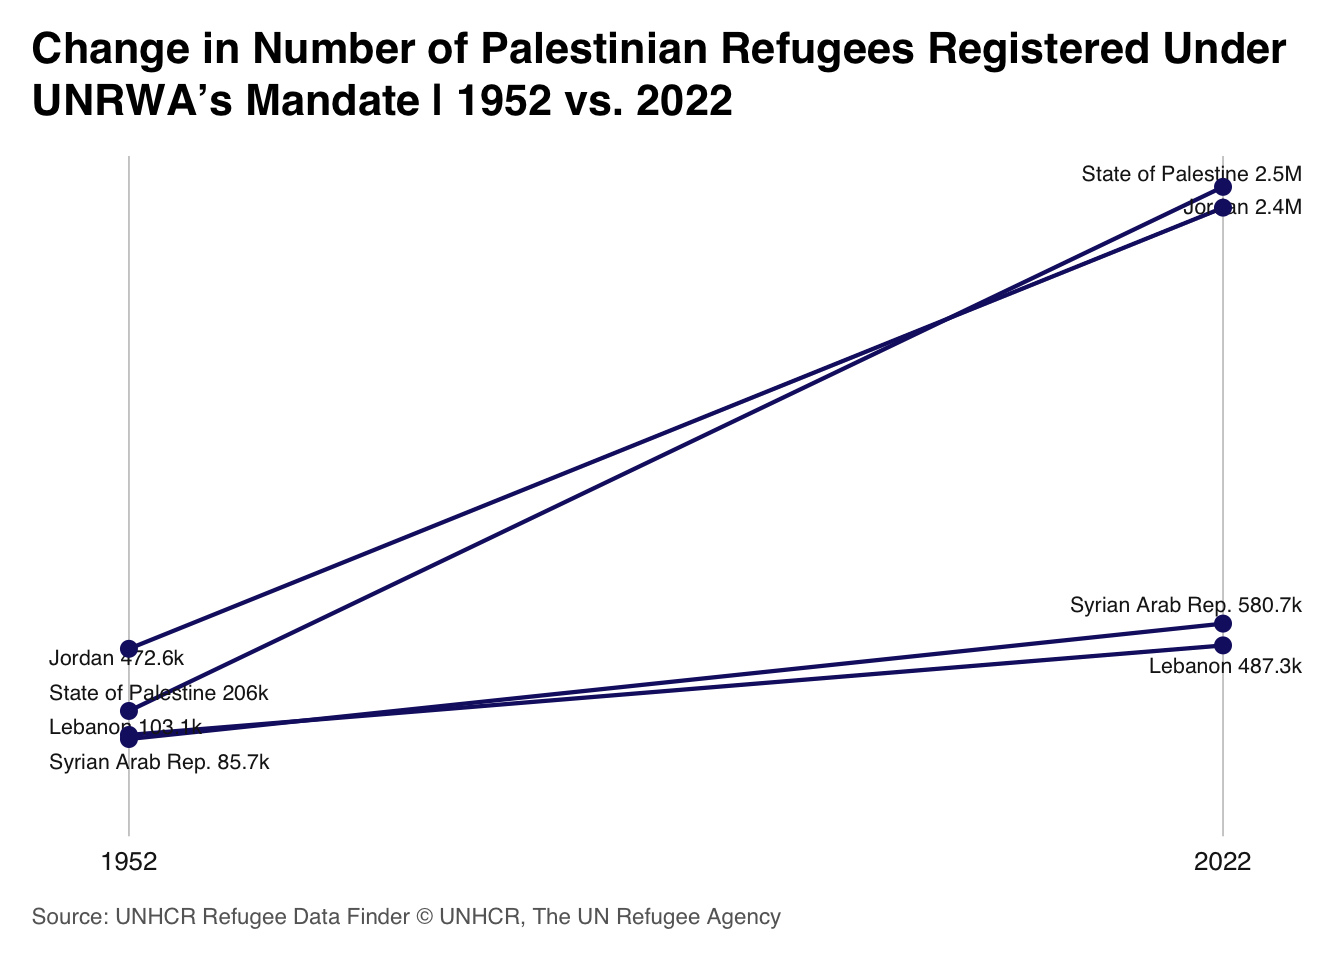
The State of Palestine and Jordan have experienced the largest increase in the number of Palestinian refugees since 1952, both increasing to above 2 million refugees. In contrast, the Syrian Arab Republic and Lebanon have also experienced increases, however not as steep. In terms of rank changes the State of Palestine now has the largest number of refugees, moving from second highest in 1952 to highest with 2.4M refugees in 2022. In second place is Jordan with 2.4M refugees, dropping to second place from first in 1952. In 1952, the Syrian Arab Republic had the lowest number of Palestinian refugees, 85.7k, this increase to 580.7k in 2022, overtaking Lebanon. Lebanon is the country with lowest number of Palestinian refugees in 2022, an increase of more than 300k.
The refugees package also contains information on asylum applicants that apply for international protection. For this visual we look at the change in total number of asylum applications in the UK from Iraqi, Sri Lankan and Iranian asylum seekers, over time:
refugees::asylum_applications %>%
  filter(coa_name == "United Kingdom of Great Britain and Northern Ireland") %>%
  group_by(year, coo_name) %>%
  summarise(total_applicants = sum(applied)) %>%
  arrange(year, -total_applicants) %>%
  ungroup() %>%
  filter(coo_name != "Unknown",
         coo_name %in% c("Iraq", "Sri Lanka", "Iran (Islamic Rep. of)")) %>%
  mutate(coo_name = if_else(coo_name == "Iran (Islamic Rep. of)","Iran", coo_name)) %>%
  ggplot(aes(
    x= year,
    y=total_applicants,
    color = coo_name
  ))+
  geom_line(linewidth = 1)+
  geom_dl(aes(label = coo_name),
          method = list(
            dl.trans(x = x + 0.1),
            "last.points"
          ),
          size = 8 / .pt
  ) +
  labs(title = "Number of Asylum Applications to the UK\nfrom Iran, Iraq and Sri Lanka | 2000-2022",
       y = "Number of people",
       caption = "Source: UNHCR Refugee Data Finder\n© UNHCR, The UN Refugee Agency"
  )+
  scale_x_continuous(breaks = pretty_breaks()) +
  scale_y_continuous(
    expand = expansion(c(0, 0.1)),
    breaks = pretty_breaks(),
    labels = label_number(scale = 10e-4,suffix = "K"),
    limits = c(0, 15000)
  ) +
  scale_color_unhcr_d(
    palette = "pal_unhcr",
    nmax = 10,
    order = c(5, 1,3)
  )+
  coord_cartesian(clip = "off") +
  theme_unhcr(
    grid = "Y",
    axis = "x",
    axis_title = "y",
    legend = FALSE
  ) +
  theme(plot.margin = margin(r = 50))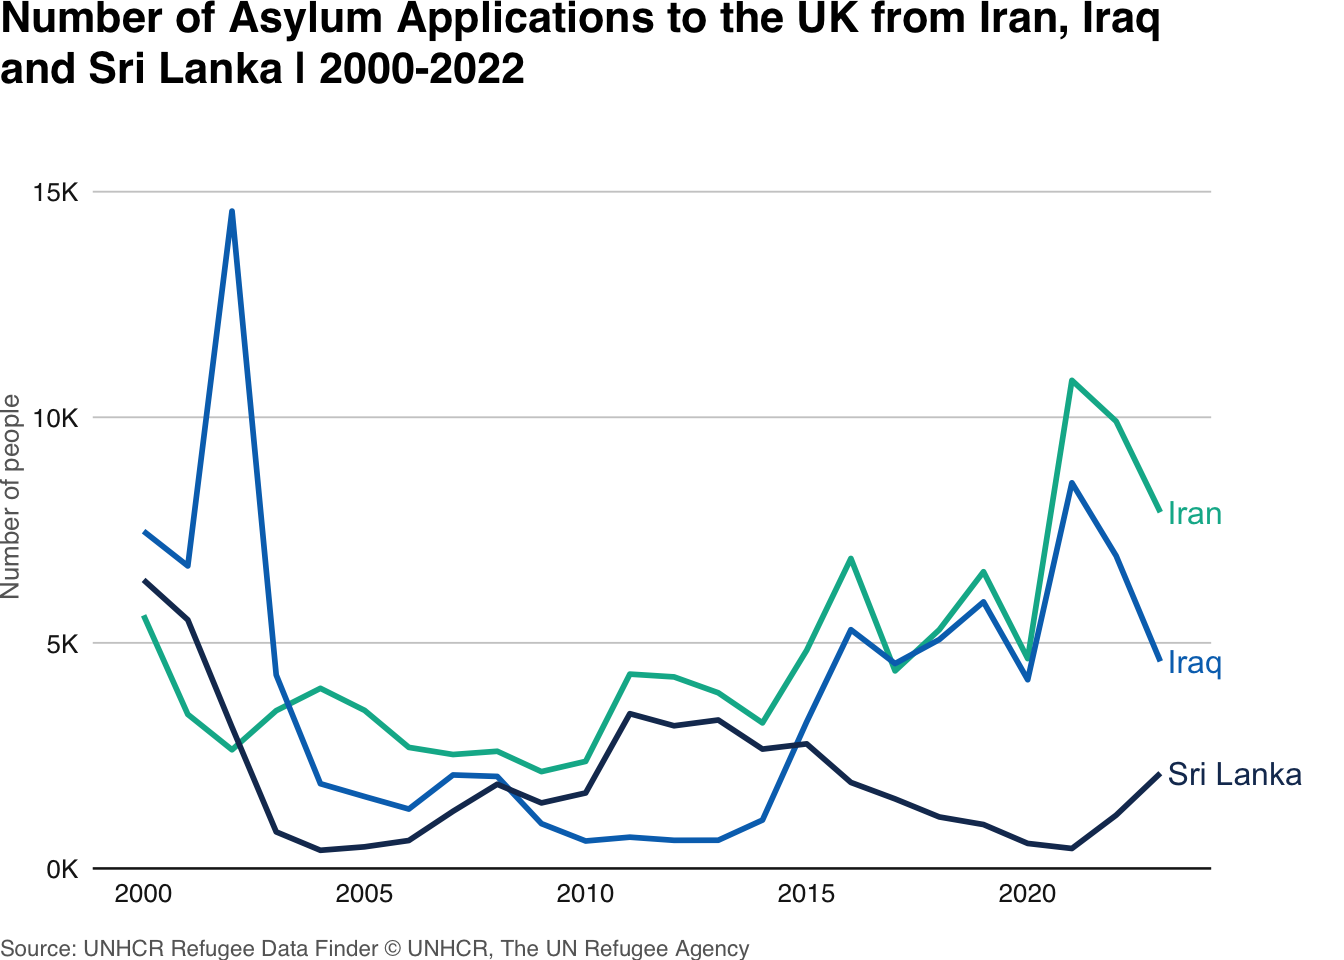
The plot above shows a few interesting changes in the data over time. The first thing that sticks out is that the number of aylum applications from Iraqi asylum seekers in the early 2000s was far higher when compared to Sri Lanka and Iran. It looks like around 2008 the number of asylum applications from Sri Lankan and Iraqi asylum seekers was nearly the same. During this time the number for Iran where higher than both of the other two, however all countries were still below 5,000. From this point until 2015, there were more Sri Lankan Asylum applications than Iraqi. After which the number of applications from Sri Lanka decreases sharply, whilst Iraq increases substantially. The numbers for Iran have for the most part been greater than the other two countries, apart from between 2000 and 2002. Iran takes the reign as the most number of Asylum seeker applications, followed by Iraq and finally Sri Lanka. This is a shift from 2000, where the ranks in chronological order was Iraq, Sri Lanka, and the Iran.
The refugee package not only contains information about asylum applications, but also the outcome of their decision. The visual below explores the proportion of the decisions that were positive/recognised by the UK, for Afghanistan, Belarus, Cameroon, Egypt, Gambia and Iran; between 2011 and 2022.
refugees::asylum_decisions %>%
  select(year,coo_name,coa_name,dec_recognized,dec_total) %>%
  filter(coa_name == "United Kingdom of Great Britain and Northern Ireland" & coo_name != "Unknown" & year >= 2011) %>%
  group_by(year,coo_name, coa_name) %>%
  summarise(dec_reco = sum(dec_recognized),
         dec_total = sum(dec_total)) %>%
  ungroup() %>%
  mutate(dec_rec_prop = round(dec_reco/dec_total,digits = 2)) %>%
  ungroup() %>%
  group_by(coo_name) %>%
  mutate(count=n()) %>%
  ungroup() %>%
  filter(count>=5) %>%
  select(-count) %>%
  arrange(coo_name) %>%
  filter(coo_name %in% c("Afghanistan","Belarus","Cameroon","
                         Dem. Rep. of the Congo","Egypt","Gambia","Iran (Islamic Rep. of)")) -> to_plot

to_plot %>%
  ggplot(aes(
    year,
    fct_rev(coo_name)
  ))+
  geom_tile(aes(
    fill = dec_rec_prop
  ),
  color = "white",
  lwd = .5,
  linetype = 1)+
  geom_text(
    aes(
      label = percent(round(dec_rec_prop,1))
    ),
    color = if_else(to_plot$dec_rec_prop > .5, "white", unhcr_pal(n = 5, "pal_grey")[5]),
    size = 9 / .pt
  ) +
  labs(
    title = "Proportion of Total Asylum Seeker\nApplication Decisions that were Recognised by The UK | 2011 - 2022",
    caption = "Source: UNHCR Refugee Data Finder\n© UNHCR, The UN Refugee Agency"
  ) +
  scale_x_continuous(
    expand = expansion(c(0, 0)),
    breaks = pretty_breaks(n = 10)
  ) +
  scale_y_discrete(
    labels = scales::label_wrap(17)
  ) +
  scale_fill_stepsn(
    colors = unhcr_pal(n = 5, "pal_blue"),
    n.break = 5
  ) +
  coord_fixed() +
  theme_unhcr(
    grid = FALSE,
    axis = FALSE,
    axis_title = FALSE,
    legend = FALSE
  )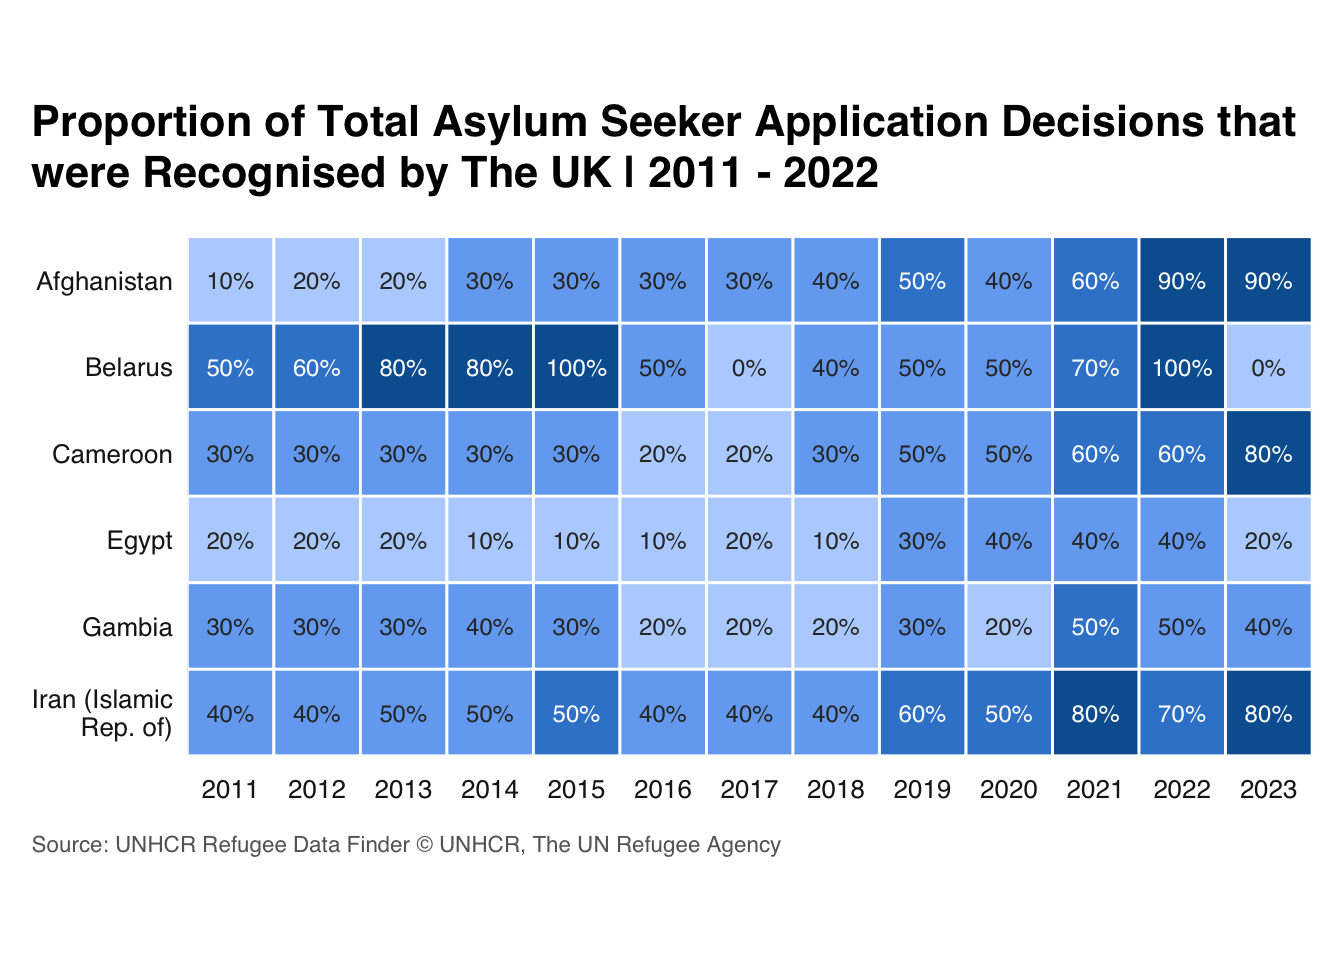
Belarus is the only country to have all Asylum applications recognised by the UK, however this was only the case in 2022 and 2015. In fact, in 2017 0% of the applications by Belorussian asylum seekers were recognised. Similarly high proportions of recognition were experienced by Iranian and Afghan asylum seekers, notably with 90% recognition for Afghanistan in 2022 and 80% in 2021 for Iran. Whilst relatively low recognition for Egyptian asylum seekers until 2018, the proportion has increased from 2019 onwards. It could be that the recent trend of increased recognition is related to an increase in the number of applications. This would be an interesting piece of research to explore.
Nevertheless, this blog explores the data available as part of the refugees package and aligns with the UNHCR data viz. guidelines. What other interesting data points and visualisations can you come up with using the package?